
KEY TAKEAWAYS:
An experience strategy without measurement is an expense, not an investment. Three KPIs—retention, spend per customer, and advocacy—turn a promotional calendar into a business case.
Define the outcome before you track the data. A retention goal, a spend goal, and an advocacy goal each require a different metric and a different follow-up action.
Net Promoter Score gives independent retailers a simple, low-cost way to separate customers who will refer new business from those who won’t, without expensive research.
A 90-day measurement system, built on data you likely already have in your POS and CRM, is enough to prove or disprove whether your experiential strategy is paying off.
Last spring, two jewelry retailers held private trunk shows. Each invited forty top customers, served champagne, and made sales that evening.
Six months later, one owner can tell you exactly how much of this year’s revenue comes from that night, which customers referred a friend, and whether their VIP segment is spending more than before the event. The other owner simply remembers it was a great night.
In Part 1 of this series, I explained why the second kind of promotion (one built on participation and access rather than markdown) wins loyalty that a 20% off sign never will. In Part 2, I walked through where these experiences belong on your calendar, who they should be designed for, and the three-tier framework that makes them achievable at any budget.
Neither post answered the question every retailer eventually must answer to a bank, a business partner, or their own P&L: Did it work? That is a measurement issue, not a planning issue, and it is where most experiential strategies quietly stall.
Why “It Felt Successful” Isn’t a Business Case
PwC’s 2025 Customer Experience Survey, which surveyed over 5,500 consumers and 400 executives, found that 57% of executives admit their loyalty programs aren’t providing the results they expected. The same research revealed a notable perception gap: about 9 in 10 executives believe customer loyalty has increased in recent years, but only 4 in 10 consumers agree.
That gap exists because most retailers are measuring the wrong metrics, or nothing at all. Attendance, social media engagement, and how the room felt are not business metrics. They tell you the room was full and whether people enjoyed themselves. They do not tell you whether the room paid for itself; and although relationships are valued, they need to convert into results in the end.
Define the Outcome Before You Track the Data
PwC’s own guidance to executives running loyalty investments is direct: decide what the program is meant to achieve—increased purchase frequency, higher average spend, or deeper emotional connection—before you choose what to measure. An experiential strategy without a defined outcome produces plenty of photos and no defensible number.
For independent jewelry and specialty retailers, the outcome almost always breaks down into four key areas: retention, customer spending, advocacy, and acquisition. Each has its own KPI, and importantly, each relates to a different type of event. A VIP preview designed for your existing customers and a public open house meant to attract new customers are not measured by the same metrics.
Retention: The Number That Protects Your Base
Retention rate answers a simple question: of the customers who bought from you last year, what percentage bought from you again this year?
Edge Retail Academy data reported by National Jeweler in January 2026 showed that independent jewelers increased gross sales by 4.7% in 2025, but this growth was driven by higher prices rather than more frequent visits. Units sold declined. The report’s direct recommendation for 2026 is proactive outreach and appointment-setting to preserve visit frequency and lifetime value, which is exactly what a well-targeted VIP preview or re-engagement event aims to accomplish.
If your experiential calendar is effective, the retention rate for the segment invited to those events should be noticeably higher than your storewide average. If it isn’t, the event was entertaining and enjoyable for your guests, not a business success.
This applies to retention-focused experiences, which are designed around your existing customer base. Not every event on your calendar is meant to serve that purpose. A public trunk show, a community open house, or a co-branded event with a nearby business aims for acquisition rather than retention, and the retention rate is the wrong metric for these. For such events, track the new customer rate instead: it is the percentage of attendees who make their first purchase within 90 days of the event.
Spend Per Customer: The Number That Grows Without New Traffic
Spend per customer measures the average amount an active customer spends with you each year, whether or not that customer is a loyalty member.
McKinsey’s research on loyalty program performance found that top-performing programs increase revenue from engaged customers by 15 to 25 percent annually through higher purchase frequency, larger average order value, or both.
This is the pillar most independent retailers already loosely track through average ticket size. The necessary shift is to track it by segment, especially for the customers who attend your Tier 1 and Tier 2 experiences, rather than across the entire store. A rising storewide average ticket can hide a flat or declining number among your best customers.
Advocacy: The Number That Multiplies Your Marketing
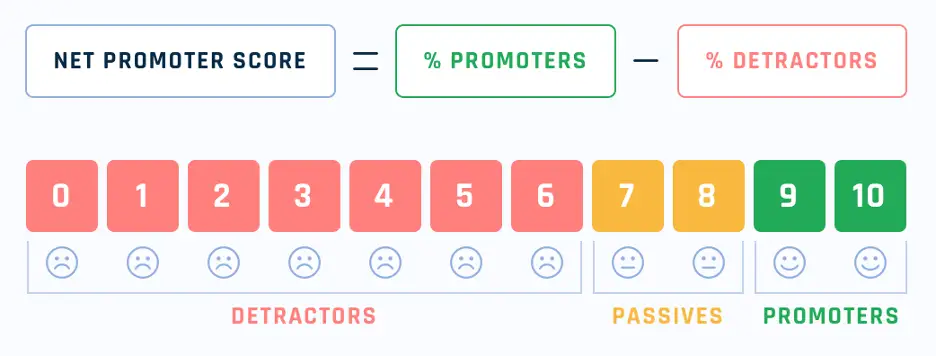
Advocacy is the pillar retailers measure least often, and it is the one with the clearest, lowest-cost measurement tool available: Net Promoter Score. NPS asks customers one question on a scale of 0 to 10: “How likely are you to recommend this store to a friend?” and sorts responses into promoters (9 to 10), passives (7 to 8), and detractors (0 to 6).
Bain & Company’s research on the Net Promoter System found that over 80% of a business’s positive word of mouth comes from promoters, while detractors account for more than 80% of negative word of mouth. Bain’s analysis of NPS and revenue growth revealed that differences in relative Net Promoter Score explain 10% to 70% of the variation in revenue growth between direct competitors, and that the lifetime value gap between a promoter and a detractor can range from 3 to 8 times.
For an independent retailer, sending a single personalized follow-up text or email with event photos after a Tier 1 or Tier 2 experience, asking the “would you recommend us?” question, is enough to start building this number. You don’t need survey software or a research department. You need an event checklist that builds habits.
A 90-Day Measurement System
Phase 1: Baseline (Weeks 1 to 2)
Pull three numbers from the data you already have. Your POS system can tell you retention rate and average annual spend per active customer. If you have never asked the recommend question, start with your next 20 transactions. You need a starting point, not a perfect one.
Phase 2: Attach Numbers to Segments (Weeks 3 to 8)
For every Tier 1 or Tier 2 experience on your calendar, record three data points: whether the invited segment’s retention rate moved, whether their spend changed in the following 90 days, and their NPS response. Your CRM should already hold the segment and attendance data; this step simply closes the loop on outcomes.
Phase 3: Report and Adjust (Quarter-End)
Compare all three numbers: retention, spend per customer, and NPS, quarter over quarter for each segment. Keep and expand the experiences that move at least one number. Cut or redesign the ones that move none. Attendance count alone is not a criterion for renewal.
The Return on Measurement
Consider an independent jewelry retailer with 200 active experiential-program customers and an average annual spend of $1,800 per customer. Applying McKinsey’s conservative 15% engaged-customer revenue lift to that base yields $54,000 in additional annual revenue, without a single new customer walking through the door.
Layer in advocacy. If 10% of those 200 customers score as promoters, and each refers just one new customer, each worth an average first-year transaction of $400, that is another $8,000 in revenue with no acquisition cost.
Now add an acquisition-focused event to the calendar. If a single public open house attracts 50 first-time attendees and 20% of them make a first purchase within 90 days with an average transaction of $400, that results in $4,000 in new-customer revenue directly linked to one event, tracked at no additional cost.
None of these numbers needed a new budget line. Each one required a prior decision on what to measure and a habit of recording the result.
Need help building a measurement system for your experiential strategy?
Let’s talk.